Case Study:
Energy Dashboard for a Fertilizer ComplexCase Study:
Energy Dashboard for a Fertilizer Complex
Energy dashboard solution to monitor and manage the energy consumption in real time - for management, engineers and operators
A large European fertilizer producer operating a multi-plant complex, with lines producing ammonia, urea, nitric acid and more.
Implementation within 16 weeks
Fast implementation for rapid benefits
In collaboration with the producer's IT team we have implemented a secure, automated data transfer from 3 different plants to our cloud.
Automated and instant data processing delivers a real-time overview on energy consumption and other critical performance parameters of each plant.
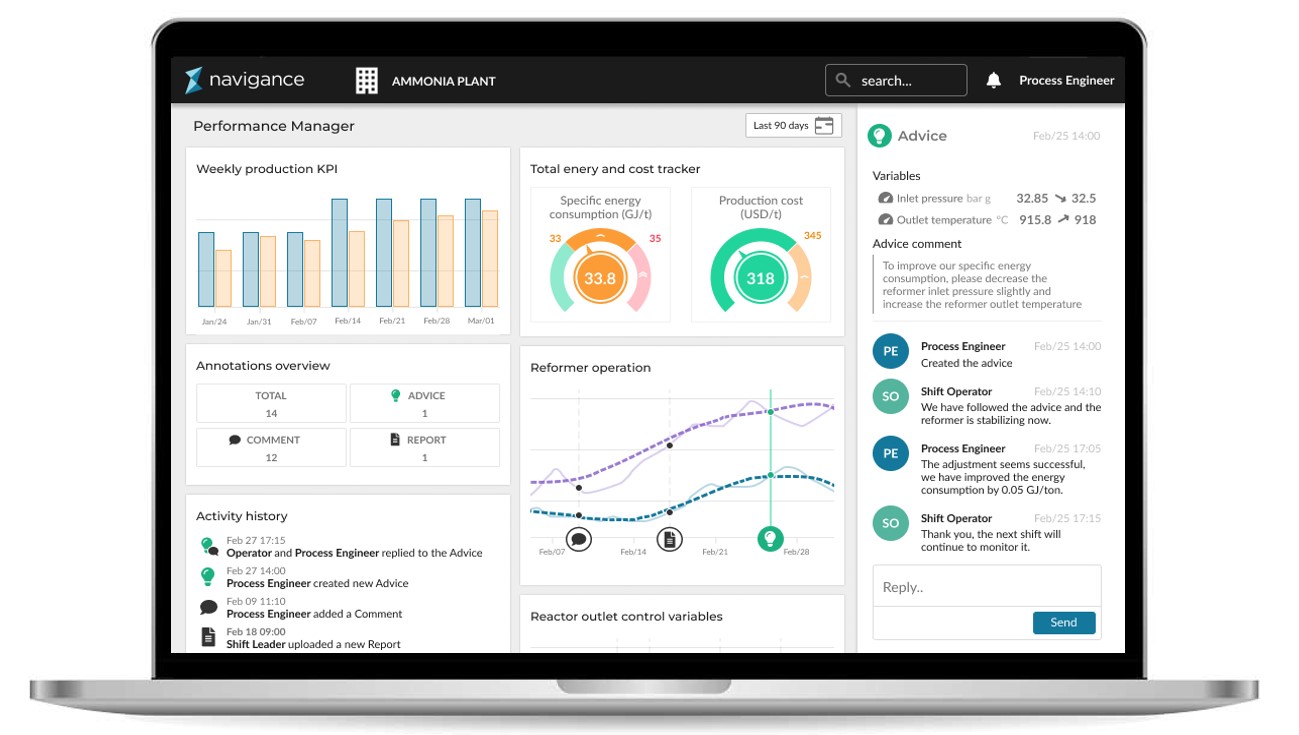
In our user-friendly dashboard each plant has tailored dashboards with specific views for management, engineers and operators. They can now track critical KPIs in real time and collaborate effectively to optimize their operations.
Customizable access rights ensure everyone sees the right information and users can tailor and maintain the information and dashboards.
The Performance Manager provides automated reporting on energy consumption and critical KPIs, on both a shift and daily basis.
In addition, it alerts the relevant teams members if fixed limits in these KPIs or related process parameters are exceeded. Operator advisory defined by engineers for these events, is visible on the dashboard and enables operators to take action quickly.
Greater transparency for informed actions
The companies management, the engineers and operators benefit from the Navigance Performance Manager:
- The plant team can now track KPIs in real time, including energy efficiency, production quality, and other environmental metrics
- Tailored dashboards enable operators, engineers and managers to see the information that matters most to them, with plant or cross-plant access
- Monitoring and alerting on critical KPIs ensures the team can react early if there’s a risk of exceeding fixed targets

Real-time insights enhance collaboration


Facts & Figures
Explore the advantages
Before the project with Navigance, the engineer of each plant used Excel spreadsheets to manually update data from different sources on a daily or weekly basis for the reporting.
With the energy dashboards and automated data transfers, the energy efficiency and other critical KPIs such as emissions and product quality is now available to the engineers and operators in real-time.
All data for needed for monitoring the energy efficiency and performance of the plant is now automatically consolidated into tailored dashboards for each plant.
Operators and engineers see the data from their assigned plant. The management team and engineers responsible for the site-wide energy monitoring see data across all plants on one dashboards.
The user access is securely managed by the fertilizer producer's IT team through Single-Sign-On authentication. All users can access the Navigance dashboards with a single click through a web-browser.
The solution provided by Navigance supports the entire organization in monitoring and optimizing its plant operations.
New sensors and calculations can be added by engineers themselves, ensuring easy and quick adaptions and extensions. Dashboards are tailored by engineers for common use and each user can create private pages for in-depth analysis of data.
Navigance provide the ability to add system extensions over time, such as advanced data analytics tools or hybrid process models for optimization.
